01
Campaign & Program Strategy
- Event activation programs
- Thematic campaigns
- Digital racing campaigns with regional rewards
- Promo package proposals and naming
Portfolio • 2026
I build
dashboards
I build dashboards, automations, and visual reports that help marketing teams run faster and decide with data.
Marketing Operations & Internal Systems

BrandComm ONE
One Platform for Brand Communication
35% → 85%
Brand Sentiment, 2020–2022
20M+
Customer Records Mapped
Data
Collect and organize marketing data
Systems
Build dashboards and automations
Visual
Turn data into clear visuals
Insight
Find the story behind the numbers
Impact
Help teams decide faster
Marketing
Campaigns, content, and social analytics
Profile · About me
7+
Years in data, marketing analytics & reporting
20M+
Customer records mapped, IndiHome ↔ myIndiHome, with RStudio
500+
Executive presentations supported
7
Dashboards and apps built, from event trackers to AI-assisted tools
How I work
Collect
Gather and structure the right data
Build
Create dashboards and automations
Visualize
Turn data into clear reports and decks
Decide
Help teams act with confidence
“Data tells a story. I make it visual, clear, and actionable.
Profile · Strengths
Five skill areas that connect program strategy, data, tools, and visuals, backed by 7+ years of working with marketing and customer data.
Tools & platforms
 Sprout SocialHootsuite
 Brand24
 Ripple10
 CapCut
 Google FlowSeedance
 AppSheet
 Glide AppsLaravelMySQLClaude CodeCodex
Profile · Experience
Growing step by step: from customer-facing roles to data analysis, then brand strategy, and now program strategy and campaigns.

Sales & customer engagement

Technical foundation

Customer experience handling
Campaign data & social reporting

myIndiHome campaigns & data mapping
Data analysis & optimization

Insight & business support

Strategy support
Program strategy & campaigns
Next chapter · Turning journey into impact
Turning data into meaningful business outcomes.
Every dataset has a story. I turn it into systems and visuals that help teams decide faster.
Builder
Dashboards and apps I built for team operations, from no-code trackers to AI-assisted platforms.
Built for my team
Built during the COVID era to record attendance.
AppSheetTracks KOL activity across regions and shows the most impactful KOLs.
AppSheetManages accessories stock for Telkom Solution and Indibiz events.
AppSheetRuns donation-based bidding at the Srikandi corporate event.
Glide AppsMarketing operations platform for event, digital, community, and media work.
Claude Code & CodexScreenshots of internal work are not shown here. A walkthrough is available on request.
Beyond work · personal projects
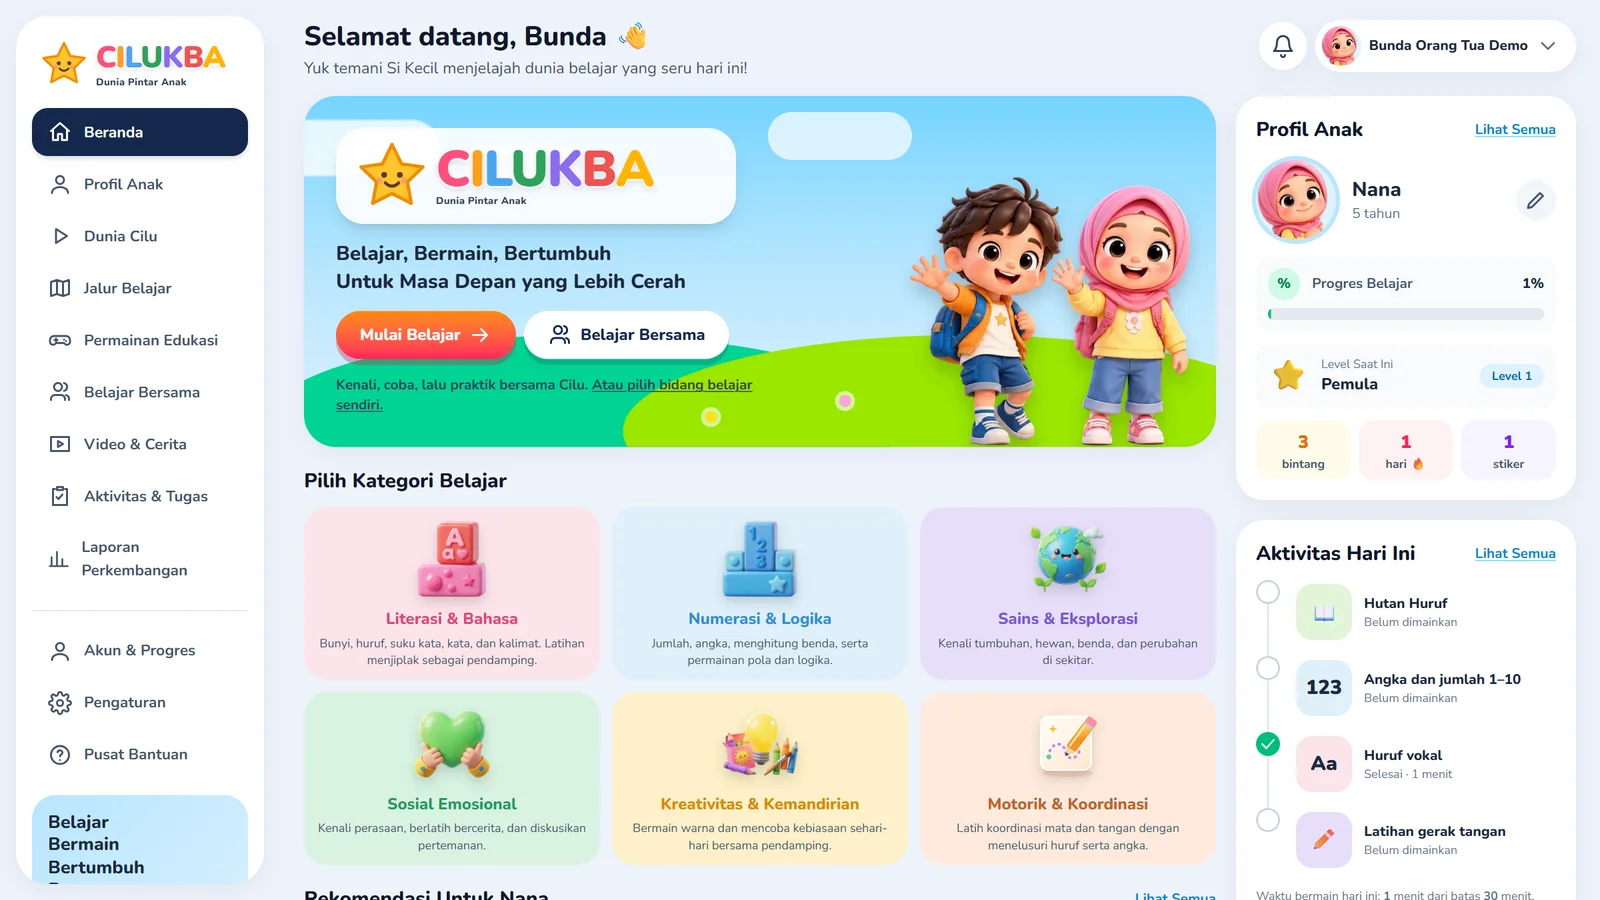
Learning app for children
A learning app for young children, guided by parents: letters, numbers, tracing, and early reading in a playful, offline-first experience.
Read the case study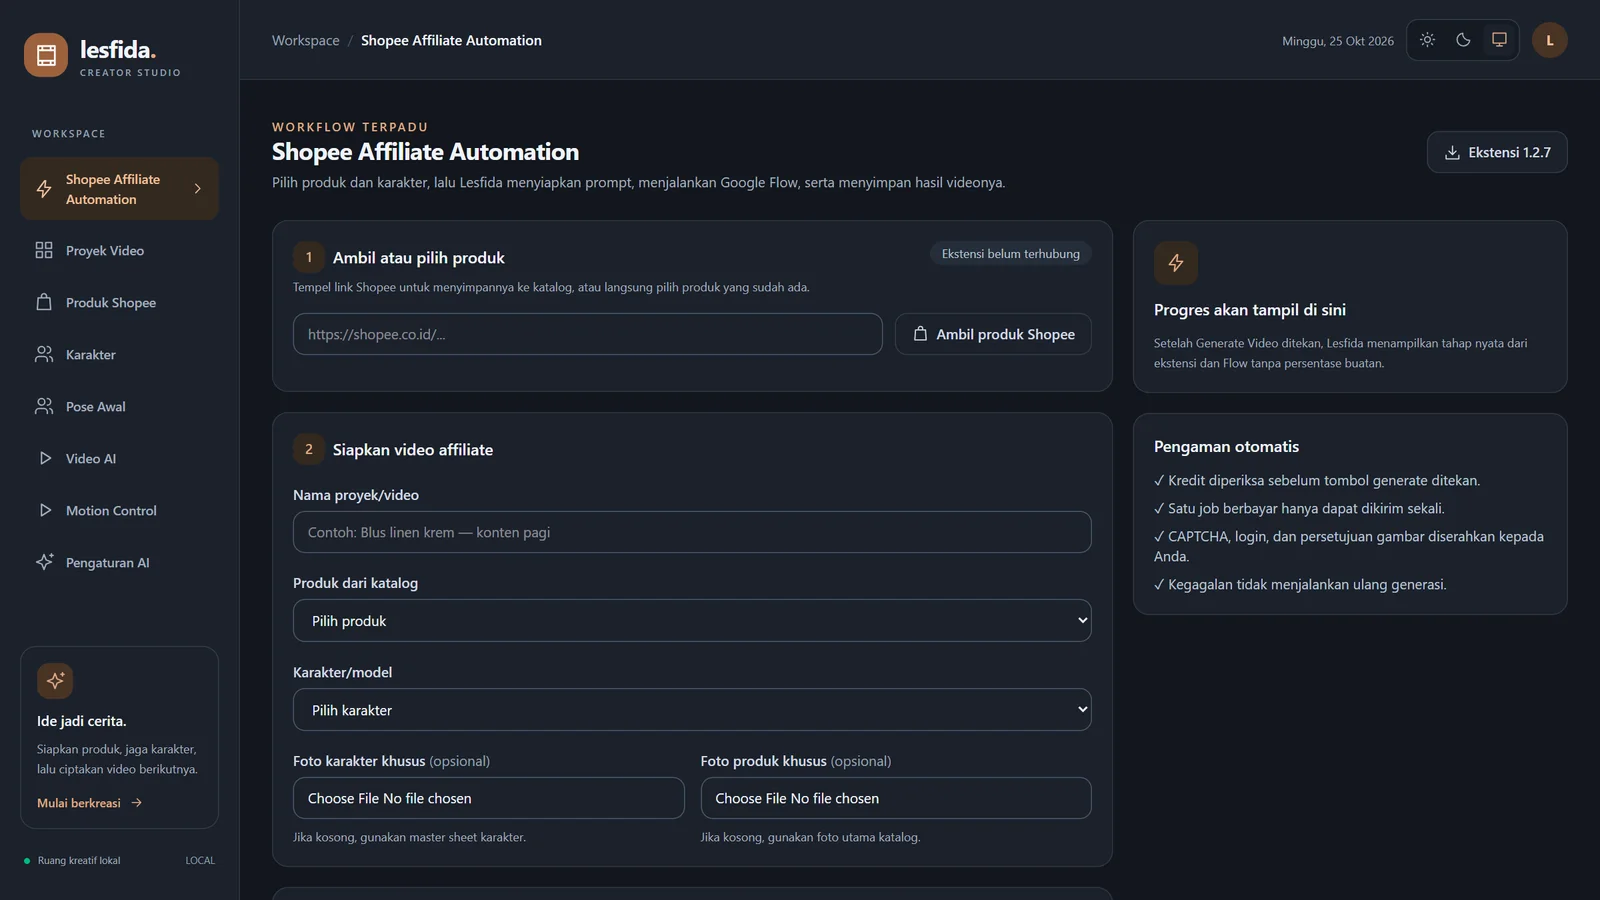
Affiliate content automation
A local studio that turns a Shopee product link into a 16-second affiliate video with a consistent AI character, ready to review and post.
Read the case studyProfile · Training
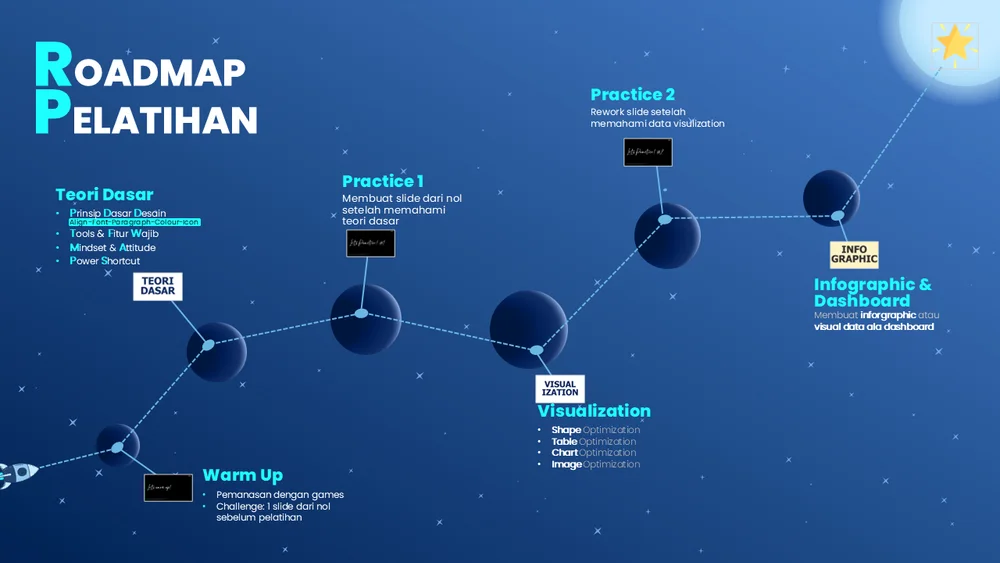
I teach PowerPoint design to colleagues in my unit under my personal brandRuang Slides.
6–10
participants from my own unit
4 hours
in person, after office hours
7 stages
from warm-up to final project
The curriculum
A game and a one-slide challenge
Align, font, paragraph, colour, icon, tools, shortcuts
Build a slide from scratch
Shape, table, chart, and image
Rework the slide with data visualization
From data to visual story
An executive summary deck per pillar
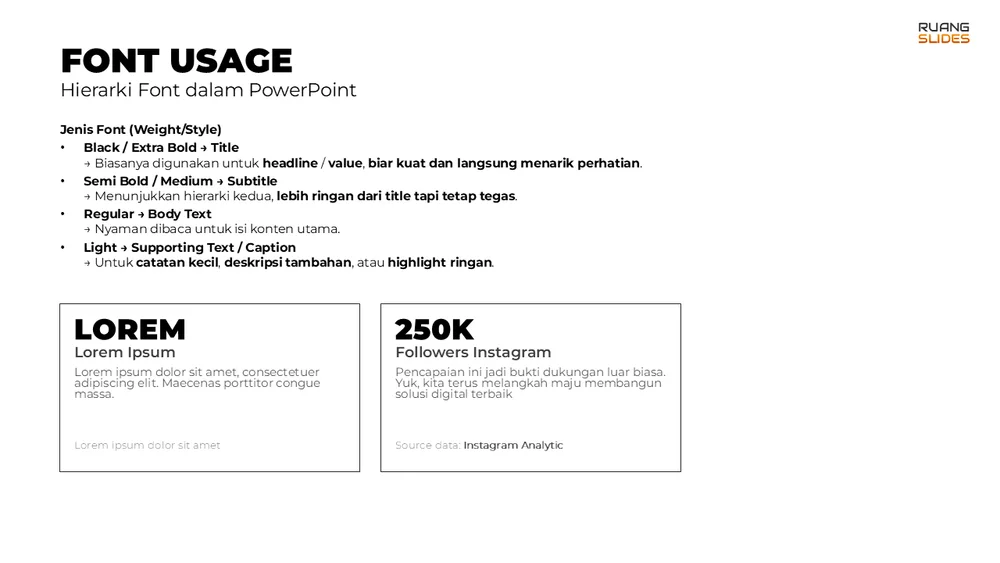
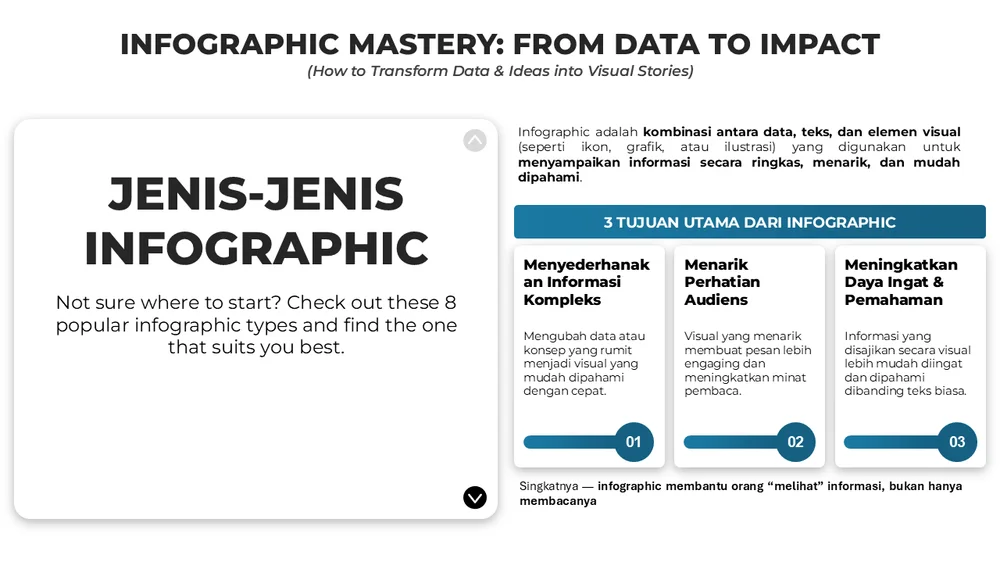
What I teach
Participants still apply these techniques in their daily slides.
Slides from my own training material.
Work with me
Beyond my day job, I take on a small number of projects that turn messy information into clear slides, simple systems, and standout career materials.
Your career story, designed. A polished PDF portfolio or a simple one-page online portfolio, plus a clean CV, built around your strongest work and the role you want.
You get: PDF or one-page online portfolio, 1–2 page CV
Rework an existing deck into a clean, consistent, easy-to-follow story. Layout, hierarchy, and visuals, without changing your message.
You get: 10–15 slides, 1 revision round
Turn raw numbers and notes into a one-page executive summary or short report your leaders can read in two minutes.
You get: One-page summary or 3–5 slides
Hands-on PowerPoint training, either for a small team (6–10 people, 4 hours) or one-on-one. Alignment, fonts, color, data visuals, and a final project you can use at work.
You get: Team or private session
A no-code app or spreadsheet system for tracking attendance, stock, events, or requests, so the team stops chasing chat threads.
You get: App or sheet, short guide
How it works
We talk about the goal, the material, and the deadline.
You receive an early version to review and comment on.
Final files, plus the revisions we agreed on.
Tell me what you need and the deadline. I will reply with how I can help.
Certified
Continuous learning that strengthens my skills and delivers greater impact.
Semesta Akademi
Completed December 2021
Marketing Institute
Completed October 2022
Asia Marketing Federation
Completed September 2024
Contact me
Feel free to reach out for collaboration, discussion, or opportunities.
From curiosity to systems. From systems to impact.